As we mentioned earlier, nanotubes are three-dimensional. Therefore, the construction of a MWD for creating a grade classification requires measurements of lengths and diameters. An example of a length distribution measurement for a SWNT sample is shown in Figure 3.
Figure 3.
Length Distribution for SWNT Sample Plotted in Histogram Form.
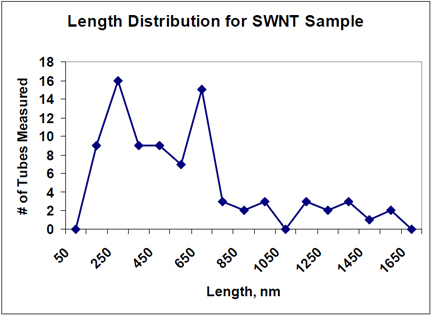
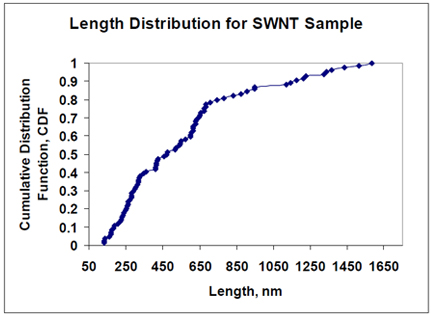
The data points were obtained from a technique using an atomic force microscope. In this case, 84 individual tube lengths were measured. In plotting the distribution, the histogram was generated by binning the measurements into ranges and plotting the number of observations at the mid-point of the range. An alternate technique is to plot every measurement as a cumulative distribution function (“CDF”)—as illustrated in Figure 4 using the same data presented in Figure 3. For our grade classifications we have found the CDF method to be more useful, as will be shown below.
Figure 3.
Length Distribution for SWNT Sample Plotted in CDF Form.
At the primary structure level, we are most concerned with the diameter, length, and number of walls of the fullerene nanotubes. These three components contribute to the molecular weight distribution of the grade. However, rather than lump these contributing factors into a MWD, we keep them separate. Thus, as we discussed earlier, the simple MWD treatment of polymers such as polyethylene is not sufficient for describing fullerenes.
The range of diameter distributions of some grades of fullerene nanotubes produced by Unidym is shown in Figure 5, using the CDF approach.
Figure 3.
Length Distribution for SWNT Sample Plotted in CDF Form.
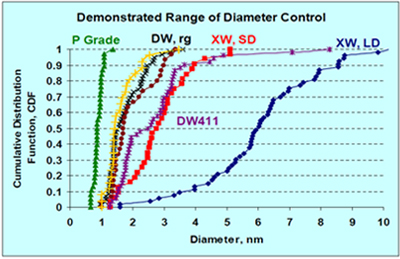
In the graph in Figure 5, it can also be seen that our grades depend upon the number of walls of the nanotube. On the far left of Figure 5, is the purified SWNT grade (P Grade) produced from the HiPCO process. The diameter distribution typically ranges from about 0.7 nm to about 1.4 nm. On the far right is the grade we call XW, for eXtra Walls. The median diameters for this grade class range from about 2 nm to 7 nm. In between the SWNT and XW grades are various double-wall and triple-wall grades and are abbreviated DW and TW. Describing the diameter distribution of DWNT, TWNT and XW becomes a bit complex if we want to describe not only the outermost wall, but also the endotopic walls. To visualize this complexity of the distribution, we have developed a plotting approach we call “tornado diagrams.”
 Sales
Sales
Ed Vega
281.647.3776
evega@ccni.biz
Carbon Nanotube
Information Resources
Carbon Nanotubes - Wikipedia
The Scale of Things
Wondrous World of Carbon Nanotubes
Nanotechnology Press Kit
Nanotechnology Brochure