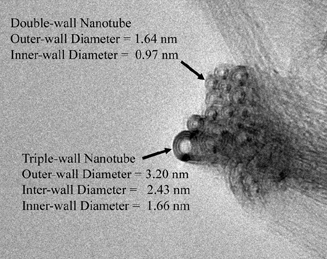
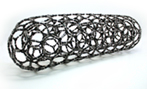
To construct a tornado diagram, we first need measurements of the cross sections of ropes or bundles to unambiguously assign diameters and numbers of walls. An example transmission electron micrograph (“TEM”) of a fullerene nanotube rope illustrating diameter and number of wall measurements is shown in Figure 6.
Figure 6.
TEM of Rope-Cross Section Illustrating Measurements
Used in a Tornado Diagram
We obtain several TEMs and then create a CDF by ranking the measurements from lowest to highest based on the outermost wall. The inner wall diameters for each tube are carried along in this ranking. The resulting diagram for one sample is shown in Figure 7a.
Figure 6.
Tornado Diagram for a DWNT/TWNT Centered Grade
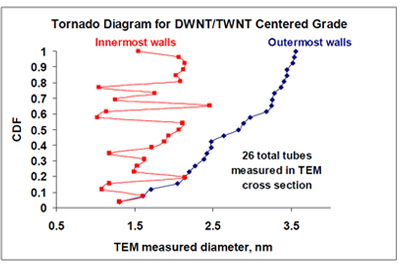
he reason these plots are called tornado plots is self evident. Figure 7a shows only the outermost and innermost diameter measurements. Where the two lines touch indicates one wall.
Figure 6.
Tornado Diagram Showing Wall# Distribution and Normally Expected Spacing
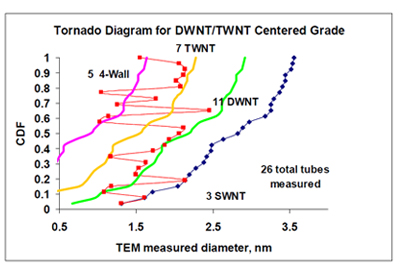
Figure 7b shows the wall count for each measurement along with the estimated inner wall positions assuming close packed graphitic spacing. Most of the inner walls are near one of these calculated lines so we call this a “full tornado.” Because the tornado is relatively full, these tubes would be very stiff. Large diameter SWNT or DWNT would be comparatively less stiff, i.e., more flexible. This particular grade would be called a DWNT/TWNT “centered” grade since most of the tubes (~70%) are two- and three-walled.
 Sales
Sales
Ed Vega
281.647.3776
evega@ccni.biz
Carbon Nanotube
Information Resources
Carbon Nanotubes - Wikipedia
The Scale of Things
Wondrous World of Carbon Nanotubes
Nanotechnology Press Kit
Nanotechnology Brochure